The noted science fiction writer Philip K. Dick once declared that “Reality is what continues to exist whether you believe in it or not.” Such an observation should be kept in mind when we consider some of the touchier aspects of American society.
Recall the notorious case of Daniel Patrick Moynihan, whose 1965 report on the terrible deterioration in the condition of the black American family aroused such a firestorm of denunciation and outrage in liberal circles that the topic was rendered totally radioactive for the better part of a generation. Eventually the continuing deterioration reached such massive proportions that the subject was taken up again by prominent liberals in the 1980s, who then declared Moynihan a prophetic voice, unjustly condemned.
This contentious history of racially-charged social analysis was certainly in the back of my mind when I began my quantitative research into Hispanic crime rates in late 2009. One traditional difficulty in producing such estimates had been the problematical nature of the data. Although the FBI Uniform Crime Reports readily show the annual totals of black and Asian criminal perpetrators, Hispanics are generally grouped together with whites and no separate figures are provided, thereby allowing all sorts of extreme speculation by those so inclined.
In order to distinguish reality from vivid imagination, a major section of my analysis focused on the data from America’s larger cities, exploring the correlations between their FBI-reported crime rates and their Census-reported ethnic proportions. If urban crime rates had little relation to the relative size of the local Hispanic population, this would indicate that Hispanics did not have unusually high rates of criminality. Furthermore, densely populated urban centers have almost always had far more crime than rural areas or suburbs, so restricting the analysis to cities would reduce the impact of that extraneous variable, which might otherwise artificially inflate the national crime statistics for a heavily urbanized population group such as Hispanics.
My expectations proved entirely correct, and the correlations between Hispanic percentages and local crime rates were usually quite close to the same figures for whites, strongly supporting my hypothesis that the two groups had fairly similar rates of urban criminality despite their huge differences in socio-economic status. But that same simple calculation yielded a remarkably strong correlation between black numbers and crime, fully confirming the implications of the FBI racial data on perpetrators.
The Pattern of Urban Crime in America
My central methodology is simple. I obtained the crime rates and ethnic percentages of America’s larger cities from official government data sources and calculated the population-weighted cross-correlations. In order to minimize the impact of statistical outliers, I applied this same approach to hundreds of different datasets: each of the years 1985 through 2011; homicide rates, robbery rates, and violent crime overall; all large cities of 250,000 and above and also restricted only to major cities of at least 500,000. I obtained these urban crime correlations with respect to the percentages of local whites, blacks, and Hispanics, but excluded Asians since their numbers were quite insignificant until recently (here and throughout this article, “white” shall refer to non-Hispanic whites).
I also attempted to estimate these same results for the overall immigrant population. The overwhelming majority of immigrants since 1965 have been Hispanic or Asian while conversely the overwhelming majority of those two population groups have a relatively recent immigrant family background. So the combined population of Hispanics and Asians constitutes a good proxy for the immigrant community, and allows us to determine the immigrant relationship to crime rates.
Presented graphically, these various urban crime correlations are as follows:

These charts demonstrate that over the last twenty-five years the weighted correlations for each of the crime categories against the percentages of whites, Hispanics, and “immigrants” (i.e. Hispanics-plus-Asians) have fluctuated in the general range of -0.20 to -0.60. Interestingly enough, for most of the last decade the presence of Hispanics and immigrants has become noticeably less associated with crime than the presence of whites, although that latter category obviously exhibits large regional heterogeneity. Meanwhile, in the case of blacks, the weighted crime correlations have steadily risen from 0.60 to around 0.80 or above, almost always now falling within between 0.75 and 0.85.
These particular calculations do rely upon several minor methodological choices. For example, I have used the 2000 Census population thresholds for selecting the sixty-odd large cities in my dataset, while I could have chosen some other year instead. The substantial annual fluctuations in the urban ethnic percentages provided by the Census-ACS estimates led me to instead use the interpolated Census figures for all years. The annual urban population totals used by the FBI sometimes differ slightly from the Census numbers, and I used the former for population-weighting purposes. However, all my results were quite robust with respect to these particular decisions, and modifying them would produce results largely indistinguishable from those presented above.
On a more difficult matter, there is always the possibility of local bias in FBI crime statistics, with the data for some cities possibly being more reliable or comprehensive than for others. But the reporting rate for homicides is widely accepted as close to 100 percent, and the close correspondence between the results for this “gold standard” crime category and those for the robbery and violent crime rates tends to confirm the validity of the latter. In any event, we would expect the highest-crime areas to be those most likely to suffer from under-reporting problems, so we would expect our figures to somewhat underestimate the true size of the correlations.
It is important to recognize that within the world of academic sociology discovering an important correlation in the range of 0.80 or above is quite remarkable, almost extraordinary. And even these correlations between black population prevalence and urban crime rates may actually tend to significantly understate the reality. All these correlations were performed on a city-wide aggregate basis. The New York City numbers include both the Upper East Side and Brownsville, Los Angeles both Bel Air and Watts, Chicago the Gold Coast and Englewood, with each city’s totals averaging those of both the wealthiest and the most dangerous districts. This crude methodology tends to obscure the local pattern of crime, which usually varies tremendously between different areas, often roughly corresponding to the lines of racial segregation. It is hardly a secret that impoverished black areas do have far higher crime rates than affluent white ones.
If instead we relied upon smaller geographical units such as neighborhoods, our results would be much more precise, but ethnicity data is provided by zip code while crime data is reported by precinct, so a major research undertaking would be required to match these dissimilar aggregational units for calculation purposes.
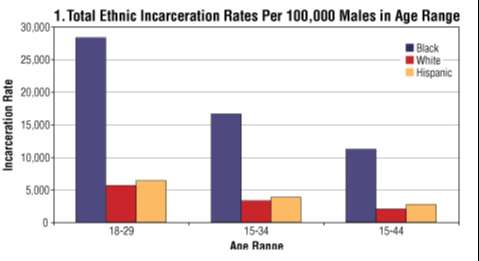
Over the last few years, the official publications of the Bureau of Justice Statistics have made it increasingly difficult to determine the racial totals of inmates in state prisons and local jails but the figures from the mid-2000s probably still provide a reasonable estimate, and I had used these in my 2010 article. Since crime is overwhelmingly committed by young males, for comparative purposes we should normalize all these incarceration totals against the base population of adult males in their prime-crime years, and the results are summarized in my previously published chart, reprinted here.
The Remarkable New York City Exception
Powerful quantitative evidence for social determinism may be dispiriting, and when the main determinant seems to be race, many Americans will choose to throw up their hands and ignore the statistical facts, simply hoping that these might somehow be proven incorrect. That is certainly their privilege, but for those individuals who prefer to grit their teeth and mine the data for contrary indications, there do exist a few interesting nuggets.
Weighted average correlations are a very useful summary statistic, but they neither tell the whole story nor do they preclude the existence of outlying cases, which might provide some insights on ameliorating the grim situation we have described. And it so happens that among our many dozens of major urban centers one of the most extreme race/crime outliers is neither small nor obscure: New York City. Our largest metropolis often has crime rates that deviate sharply from the usual urban pattern observed almost everywhere else.
if America’s other cities with large black populations had somehow managed to achieve the same surprisingly low crime rates as New York City then most of the high racial crime correlations that have been the central findings of this article would disappear. Conversely, if New York City were excluded from our current national statistics, many of the existing racial crime correlations would exceed 0.90. These are objective facts and well-intentioned analysts who sharply criticize New York City policing methods should recognize that they may face some unpalatable choices...........
.........If we examine the 2011 homicide rates for our set of sixty-six large cities, seventeen of these were at least 30% below the projected trendline, with four cities—Charlotte, Raleigh, St. Paul, and Virginia Beach—achieving even better results than New York City. But many of these successful cities have numerically small black populations, and the total for all seventeen combined is not much larger that of New York City alone. One intriguing fact is that although fewer than one-third of the all our large cities lie in the South, these Southern cities account for over two-thirds of those particularly successful examples, and a roughly similar pattern applies both for other crime rates and for other recent years. The exact mix of cultural, socio-economic, or demographic factors responsible for such notable Southern success in achieving relatively low urban crime rates is unclear, but might warrant further investigation.
Consider that over one-quarter of all the urban black males in America have vanished from our society, a loss-ratio approaching that experienced by Europeans during the Black Death of the Middle Ages. Yet these astonishing statistics have largely remained unreported by our major media and hence unrecognized by the general American public. Should the medieval scribes of the Fourteenth Century have ignored the annihilating impact of the bubonic plague all around them and merely confined their writings to more pleasant news?
It is said that very young children sometimes believe they can hide themselves by covering their eyes, and that seems to be the general approach taken by our major media to the unpleasantly grim racial crime statistics analyzed in this article. But the reality continues to exist whether or not we ignore it.
This has been a summarized article, the full, original versions by Ron Unz is available at the Unz Review